What this section is for
By the time a coin shows plus forty percent for the day, the move is usually over — and what you see on the chart is somebody else earnings.
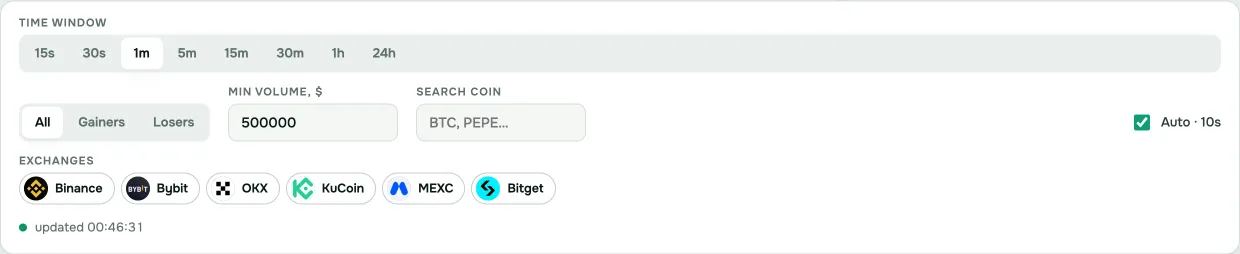
Monitoring is about something else: seeing the surge in its first minutes, while it is still running. That is why the windows here are short: fifteen and thirty seconds, one minute, five, fifteen, thirty and an hour.
Why there is no one-second window
Because it would be fiction. Prices arrive from every exchange in the review at least every 30 seconds: polling venues more often would hit their rate limits.
The shortest window is fifteen seconds, and not every pair fills it. Anything shorter we could draw, but it would be interpolation rather than data.
For the same reason, windows the scanner has not yet accumulated are shown dimmed: two minutes after startup there is simply no hourly window.
How to use it in arbitrage
A sharp surge is almost always the moment when prices between exchanges diverge. One venue has updated, another lags by tens of seconds. That interval is where the widest spreads appear.
- Spot a coin surging on a short window.
- Open cross-exchange arbitrage and see whether its prices have diverged.
- Check book depth — it collapses at moments like these.
- Check in transfers that withdrawals for the coin are open.

What this section does not do
It does not predict. A coin up 30% in five minutes can continue or give it all back just as fast. This is an observation tool, not a source of buy signals.
Chasing the move itself is no longer arbitrage but speculation, where you bet on direction. Our job is different: to see the moment venues diverged in price.
What to remember during a surge
- The book empties. Market makers pull orders and slippage multiplies.
- The spread looks enormous. Executing it at the stated size is often impossible.
- Exchanges suspend withdrawals. Routine during sharp moves, and it makes the route unexecutable.
- The spread closes fast. Usually in minutes: everyone watches hot coins.
Frequently asked
Why do exchanges show different numbers for one coin? Each has its own book, and during movement they do not update simultaneously. That is the source of the spread.
Can I trade direction from this section? You can, but that is not arbitrage. It shows what happened, not what will.
Why are some windows greyed out? The scanner has not yet accumulated that much data since starting. After an hour all windows are live.