Why calculate before trading
The most common beginner story: saw a 2% spread, did the trade, made nothing. The money did not vanish — it went into fees that were not in the number on screen.
A calculator exists for one thing: seeing the result before you spend the time. Thirty seconds of arithmetic saves half an hour of pointless work.
What comes out of the spread
- The first trade fee — buying. Usually 0.1%, and zero for makers on some venues.
- The second trade fee — selling. The same again.
- The network transfer fee — depends on the network, not the amount: from 0.001 USDT to several dollars.
- Slippage — if your amount exceeds what sits at the best price.
- Price movement while the transfer is in flight.
The first three are exact, the fourth is estimated from book depth, the fifth is a risk you remove by keeping balances on both venues in advance.
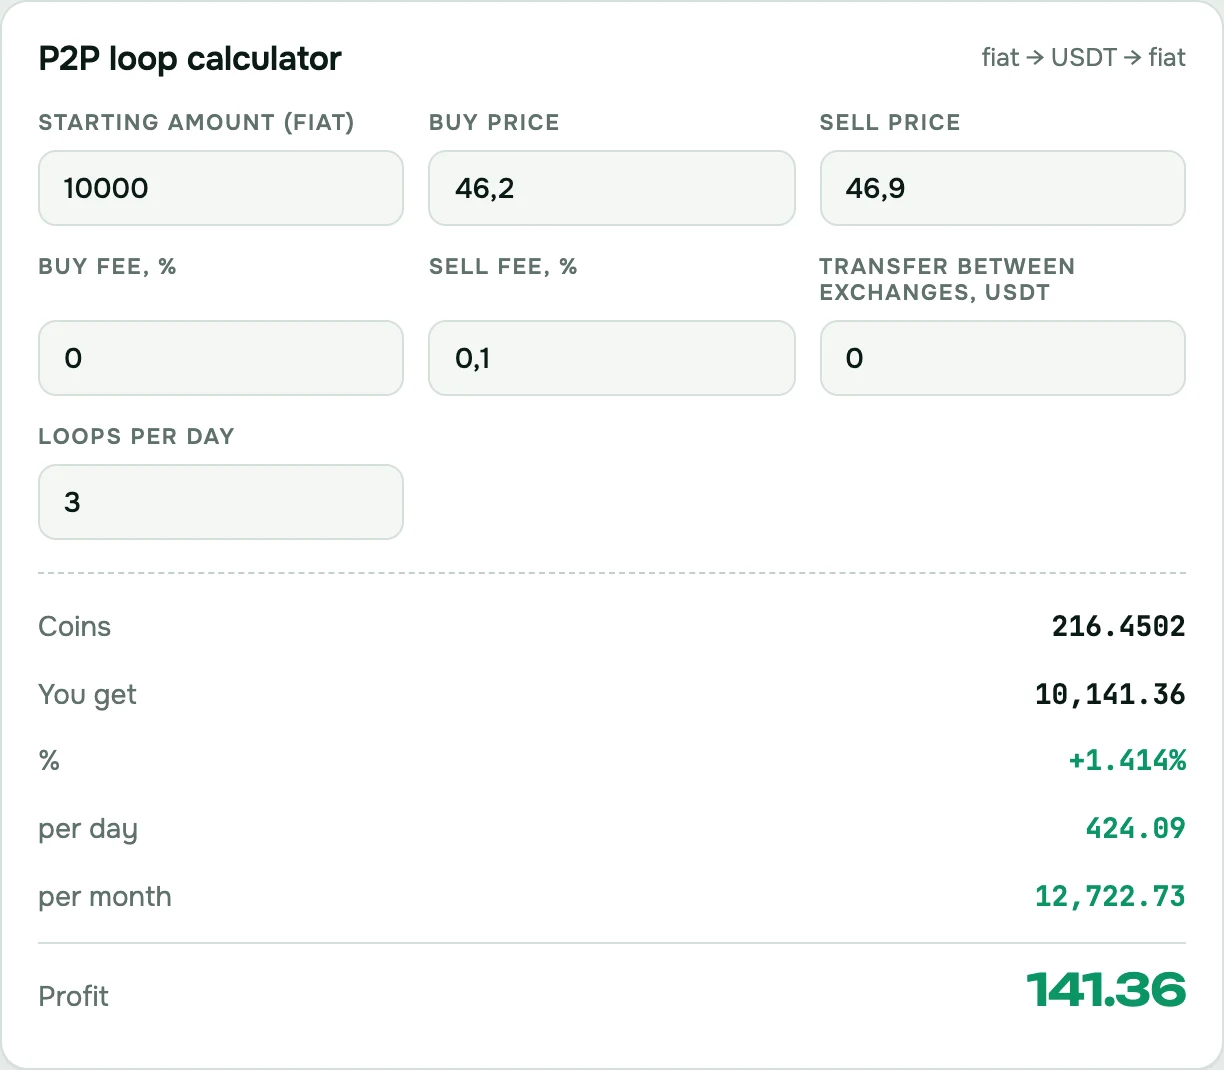
How to use it
Open the calculators and fill the fields honestly.
Amount — your real one, not a round thousand. It drives both the profit in money and the slippage.
Buy and sell prices — the ones you see in the scanner or on the exchange right now.
Fees — your actual ones. If you have a discount for an exchange token or a volume tier, enter it and the numbers change immediately.
Transfer network — the one you will really use. The gap between 0.001 and 1 USDT decides everything on small amounts.
The rule: a percentage without an amount means nothing
First case. A 6% spread with 60 USDT available. The gap is 3.6 dollars, and about three remain after fees — for two trades and a transfer.
Second case. A 1.5% spread on 3000 USDT. The gap is 45 dollars and about 40 remain.
The percentage is four times smaller and the money thirteen times larger. That is why the spot and futures arbitrage tables and P2P rates show the available size beside the price.
The thresholds that come out in practice
- P2P: from 1%.
- Cross-exchange spot: from 0.6%.
- Triangular: from 0.1% with a zero maker fee, otherwise from 0.35%.
- DEX to CEX: from 1% on cheap networks, 4–5% on Ethereum.
Below those a route is not so much unprofitable as not worth the time.
Frequently asked
Why does the calculator show less than the scanner? The scanner shows the gap between prices; the calculator shows what is left after costs. The second is your money.
What slippage should I assume? 0.1–0.2% on liquid pairs, 0.3–0.5% on medium ones, from 1% on small ones.
Should I include taxes? The calculator handles the trading result. Tax depends on your country.